


Release Spotlight: Nucleus Trends Page Update

You only need to take one look in the condiments section of a refrigerator to understand that things don’t necessarily get better with age. As with ketchup turning green or salad dressing acquiring a paste-like consistency, aging vulnerabilities (vulns) can harm your health. Most vulnerabilities, especially the critical ones, are like fresh salsa: you want to get through them quickly before they cause problems.
Fortunately, the Nucleus team has been hard at work developing ways you can keep your vulns from turning sour. On Wednesday, the 24th of May, we released a new Trends Page update designed to provide expanded information on the age of vulnerabilities in your projects to help you monitor your vulnerability management performance and progress over time even more effectively.
What has changed and why it matters
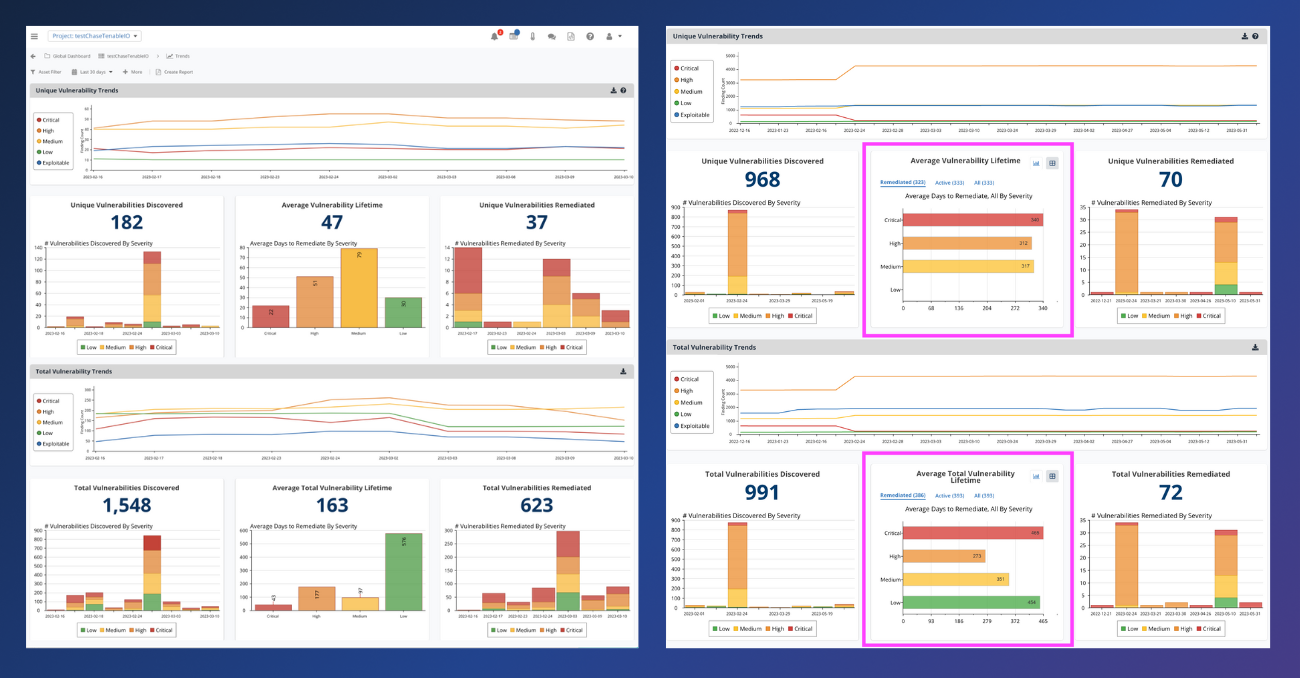
Previously, the Trends Page showed only the average lifetime of remediated findings by severity. With this update, you now have the option to view the average age of active or all findings while still being able to view the average lifetime of remediated findings.
This change represents a massive time saver for organizations that use metrics like vulnerability age (also known as dwell time) in conjunction with time-to-remediation to track the success of their vulnerability management programs. You can now more easily answer two related but distinct questions:
“How long is it taking me to patch?”
(i.e., what is the lifetime of remediated findings)
“How long have vulnerabilities been active in my environment?
(i.e., what is the age of active findings)
Questionable food metaphors aside, vulnerability age is a north star metric for many vulnerability management leaders. It’s a quickly comprehensible metric that rolls up the performance of all aspects of vulnerability management, from discovery to resolution. The lower the average age of vulnerabilities in your environment, the better your team identifies and resolves them.
Because you will never be able to resolve all vulnerabilities (nor should you, arguably), defining filters for which vulns you’re trying to resolve more quickly is vital. Like other metrics on the page, you can filter these new metrics by useful asset or vulnerability parameters to drill into specific aspects of your programs and compare performance. For example, you can view how long vulns are active for one product versus another, one team versus another, or one vuln source versus another; this is easy to do with the asset group and vulnerability filters on the Trends Page.
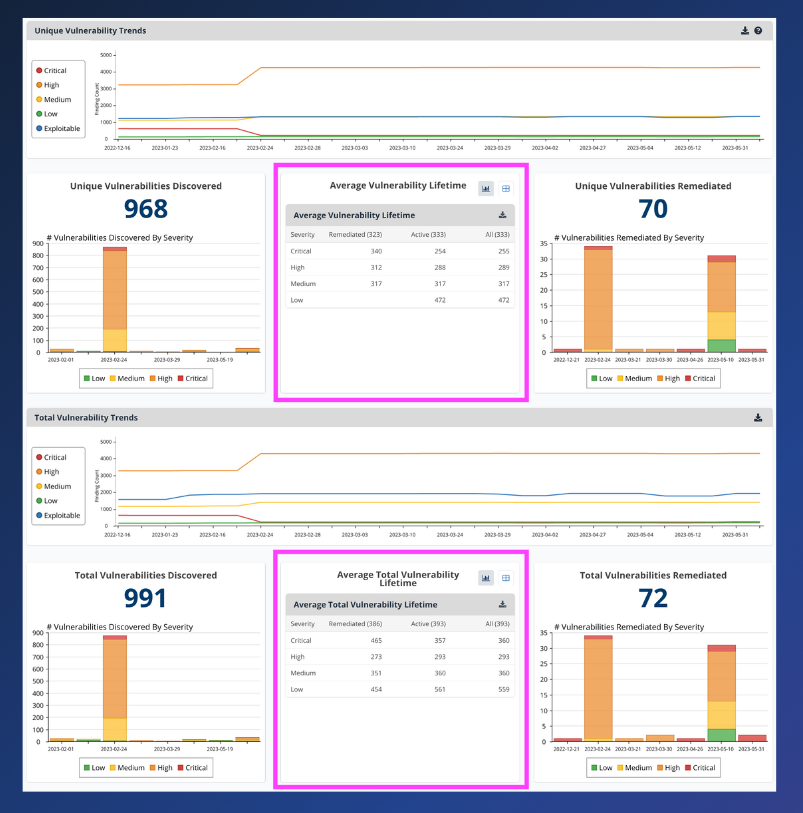
We’ve also added a table view so you can quickly expose the raw numbers populating the chart.
How it works
The average age of remediated vulns remains unchanged with this release, but here’s a refresher on how it works: For unique vulns, the lifetime reflects discovery to remediation of all fully remediated unique vulns as of the selected time period. Note: Each fully remediated unique vuln includes the remediation of all associated instances. For total vulns, the lifetime reflects discovery to remediation of each remediated vuln instance as of the selected time period. Here’s an example:
You discover a vulnerability with 50 unique instances across your environment. This vulnerability would be reflected in your average age of remediated vulns as follows:
1. Unique: Length of time from discovery to remediation of all 50 vuln instances.
2. Total: Average time from discovery to remediation for each vuln instance.
For active vulns, the age shows the average length of time since discovery for all vulns which were active during the date range selected. For unique vulns, the lifetime reflects the time since the first discovery of an instance of that vulnerability in your environment. For total vulns, the lifetime reflects the average time since the first discovery of each vuln instance. Here’s an example:
Imagine the above vulnerability is still active in your environment, with 30 instances remaining. This vulnerability would be reflected in your active vulns during a given time frame as follows:
1. Unique: Length of time since the first vuln instance was discovered.
2. Total: Average length of time since each vuln instance was discovered.
For all vulns, the age shows an average, including both the remediated and active findings.
You can check out our documentation on the Trends Page updates for more info and examples.
Put it to use
There are many ways to define “what good looks like” in vulnerability management. Setting realistic goals and expectations around SLAs for resolving vulnerabilities is one way to drive success. Regardless of how this works in your organization, one thing is clear: allowing vulns to linger is always challenging. For this reason, we recommend aligning your teams around tracking the lifetime of remediated vulns and the age of active vulns to evaluate the performance of your vulnerability management program.

See Nucleus in Action
Discover how unified, risk-based automation can transform your vulnerability management.

